S&P 500 vs. MSCI World – Which Index is Better?
Today’s investment winners can become tomorrow’s losers. But is a globally diversified portfolio still the ultimate antidote to this constant uncertainty?

Comparing the S&P 500 Index and MSCI World Index is a smart way to educate yourself on the differences between investing in the U.S. vs. the entire developed world. Both indexes have historically delivered excellent returns, but choosing between them involves a trade-off and a role of the dice: The S&P 500 represents the strength of the U.S. financial markets but is geographically concentrated; the MSCI World has a global outlook but risks being spread too thinly. Which one should you pick then?
When deciding between the S&P 500 and the MSCI World, the question investors need to ask themselves is whether they think international (incl. U.S.) or U.S.-only stocks are the better long-term investment. The strong outperformance of the U.S. market in recent decades makes diversification a bitter pill to swallow, and the case for investing internationally hasn’t exactly been obvious over the past several years.
Still, the accomplishments of U.S. stocks over international stocks are not without historical precedent. A peek into the past reveals that market winners tend to rotate between regions over time. Historically, periods of outperformance have been followed by a reversal to the mean.1 The case of Japan, the most famous example of this phenomenon, serves as a stark reminder that even the most triumphant markets can experience a reversal of fortune.
Nota bene
The language used to discuss international and U.S. stocks is heavily biased towards the U.S. perspective and can be confusing for non-U.S. investors. In English-language literature and online discussions, the term “domestic” often means the U.S. market, while “international” means everything else. It’s not very fitting, but worth keeping in mind.
What you need to know
- What they are: The S&P 500 and MSCI World are two of the most popular stock indexes for passive and “Boglehead” investing. The S&P 500 is specific to the U.S. stock market, while the MSCI World covers developed markets. You can invest in these indexes through a mutual fund or exchange-traded fund (ETF) that copies and owns the underlying stocks. European investors seem to prefer World indexes, while Americans prefer their own market.2
- The S&P 500 index: The S&P 500 comprises 503 large-cap stocks from all major sectors of the U.S. economy. It’s the world’s most tracked index, with over USD 15 trillion tied to it.3 Investing in the S&P 500 brings the benefit that the U.S. is home to the world’s largest and most successful companies and the world’s only reserve currency.
- The MSCI World index: The MSCI World is the original global stock index that covers around 1,500 large- and mid-cap stocks from 23 developed countries, including the U.S. Around 65% of the companies in the S&P 500 are also found in the MSCI World. “Globalhead” investors like the MSCI World because it is geographically diversified across the world’s largest markets and automatically shifts weight towards companies that are doing better. This approach provides a nicely balanced mix that avoids the extremes of being one hundred per cent invested in a single country while also sidestepping the risks of small stocks and emerging markets.
- What’s worth keeping in mind: S&P 500 companies generate roughly 40% of their revenues outside the U.S. In the tech sector, the number is 58%.4 This provides a significant level of indirect diversification that is often ignored.
Do you need global diversification?
Investors around the world have a soft spot for investing in their own country. This phenomenon is known as “home bias” and is present in both the stock and bond markets. Research shows that Europeans invest 65% of their portfolio in domestic equities, Americans 86% and Japanese 90%.5 In other words, people are still patriotic when it comes to investing, to the degree that you would think that dabbling in other markets is like being asked to support a foreign sports team.
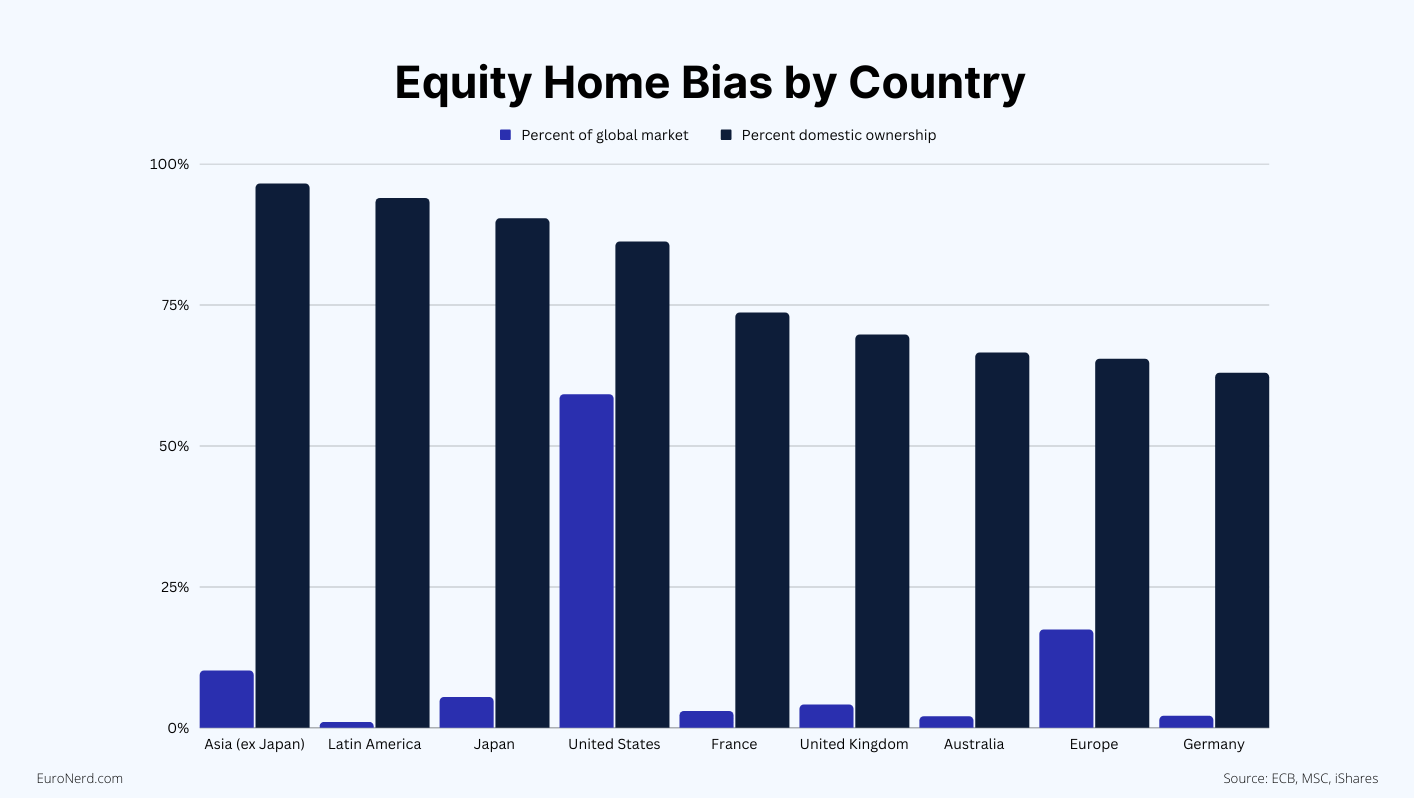
Familiarity, perceived risk, ease of access, and transaction costs are some of the reasons why investors stick to their home stock market. Very often, this choice is driven by emotions rather than objectivity. When we look at how much of the world’s stock market is made up of different regions, we can see that the U.S. represents around 60%, Europe 19%, and East Asia 17%.6 Based on this distribution, there is little logical reason why investors would choose to only invest in their own stock market, as great companies are spread all around the world.
A simple way to build a portfolio that avoids home bias would be to compare the current value of all the world’s stocks and invest a corresponding proportion in each. This is more or less how domestic stock indexes like the S&P 500 and U.K.’s FTSE 100 work on a national level. The MSCI World and its big brother, the MSCI ACWI, do this on a global level. Apple, for example, takes up around 7% of the S&P 500 because investors consider it the most valuable company in the U.S. and believe it has future worth. Similarly, it takes up 5% of the MSCI World because that’s how much of the developed world’s stock market it represents.
The risk of going all in: The extreme case of Japan
In the 1980s, Japan’s stock market was on top of the world. Japanese companies were thought to be so valuable that they made up a staggering 40% of the global market. The Nikkei 225, Japan’s benchmark index, had an astronomical P/E ratio of 60, which means that investors were willing to pay 60 yen for every yen a company made in the past year. Things really exploded in 1986 when the Nikkei shot up 49% in that year. One of the most absurd cases was Japan Air Lines which sold at a P/E of 400. Investors simply couldn’t get enough of Japanese stocks.
The frenzy was also present in the property market, where land prices had increased by 5,000% from 1956 to 1986. At the top of the bubble, Tokyo properties were valued 40 times greater than those in London. The total value of the Japanese property market was a mind-blowing 2,000 trillion yen, 4 times that of the entire United States.7
But as with all bubbles, the Japanese bubble had to burst. From the turn of the 1990s, the Nikkei plummeted more than 60% within a span of just five years. By 1992, Japanese property prices had fallen by 50 per cent.8 Despite attempts to revive the Japanese market, it has yet to return to its former glory and remains well below its peak. The burst of the Japanese bubble was caused by a mix of factors, including international trade imbalances, the Plaza Agreement of 1985, which artificially lowered the value of the yen and a weak central bank. Last but not least, the influx of money from investors who got caught up in the hype.
When buy-and-hold doesn’t work
If you invested $100,000 in 1970 in large Japanese companies, by 1989 that investment would have grown to $5.7 million. But by 2015, that same stock portfolio would only be worth $90,400. The same holds true for small companies, where an investment of $100,000 would have grown to $18.3 million during the same period, but by 2015 it was worth just $149,000. Case in point: a buy-and-hold strategy doesn’t work if it fails to protect against bubbles.
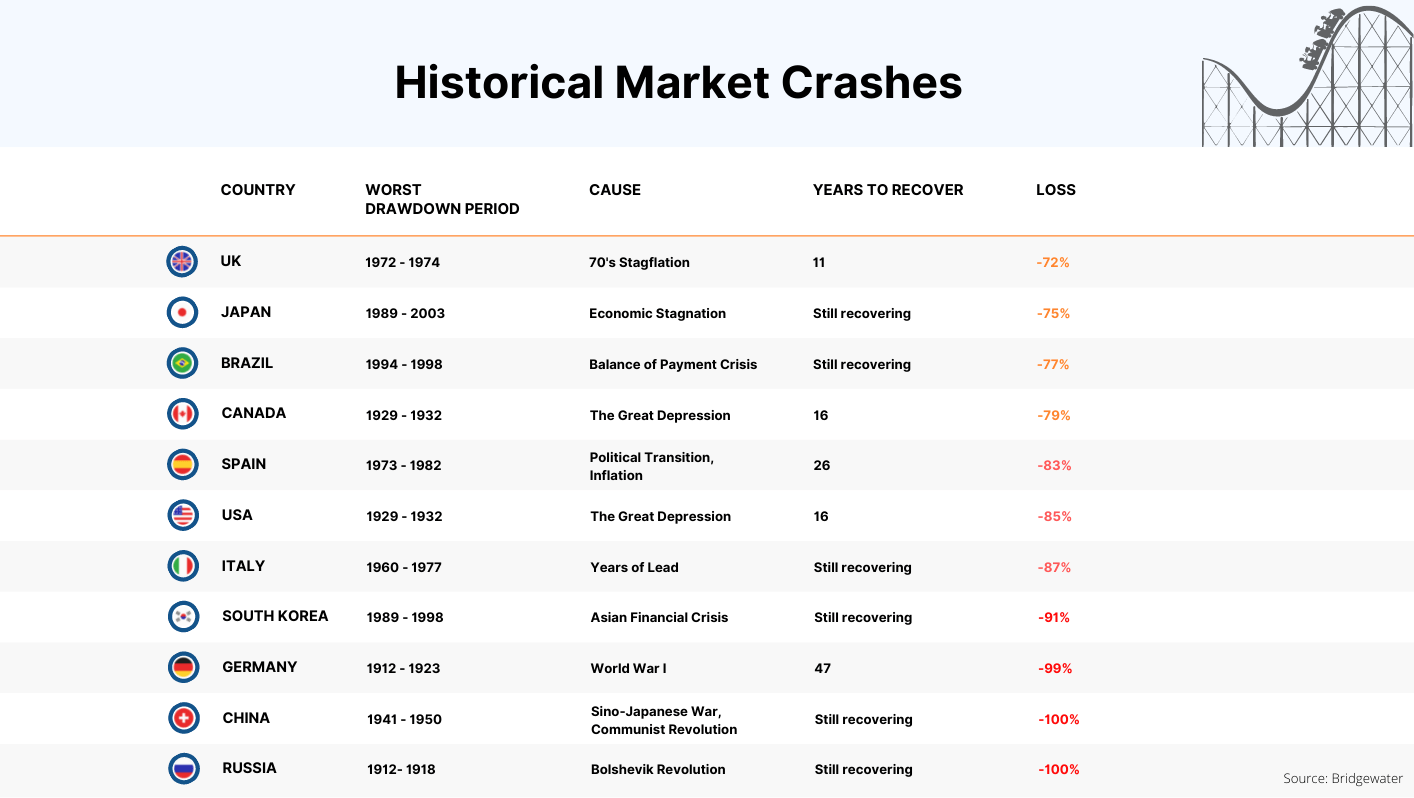
The causes of the Japanese crash are unique, but it’s not just a one-off event – history is littered with examples of markets plummeting and taking decades to recover. Here are a few examples in USD terms:
- Russian stocks saw a -100% loss in value during the Bolshevik Revolution of 1912-1918 and may never recover.
- During World War I, Germany experienced a drawdown of -99% from 1912-1923, and it took 47 years to recover. German bonds issued during this time period lost 95% of their value and have never recovered, even after 900% of excess growth since then.
- Canada suffered a downturn of -79% in the Great Depression of 1929-1932, and it took 16 years to recover.
- The U.S. suffered a -85% slide in the Great Depression of 1929-1932, and it took 16 years to recover.
- The Chinese market became more or less worthless after the Sino-Japanese War and Communist Revolution from 1941-1950.
- Italy fell -87% during the Years of Lead from 1960-1977 and is still recovering.
- During the 70’s Stagflation period, the U.K. experienced its worst drawdown period with a loss of -72%, and it took 11 years to recover from the crash.
- Spain experienced a political transition and inflation period from 1973-1982, with a decline of -83%, and it took 26 years to recover.
- South Korea retreated -91% during the Asian financial crisis from 1989-1998 and is still recovering.
- Brazil experienced a balance of payment crisis from 1994-1998, with a nosedive of -77%, and is still recovering.
The most dramatic instances of deep downfalls were caused by extreme political or economic upheaval, such as wars and regime changes – some of which seemed unlikely years before they took place but look obvious when we look back with the benefit of hindsight.
The bottom line is that diversification involves crossing borders. Professional portfolio managers understand this and don’t limit themselves to just one market or region. Large investment funds, like Norway’s 1.3 billion euro Pension Fund, follow a global strategy and diversify their portfolio by investing in developed and developing countries, company sizes, and asset classes to avoid bubbles and smoothen out market fluctuations.
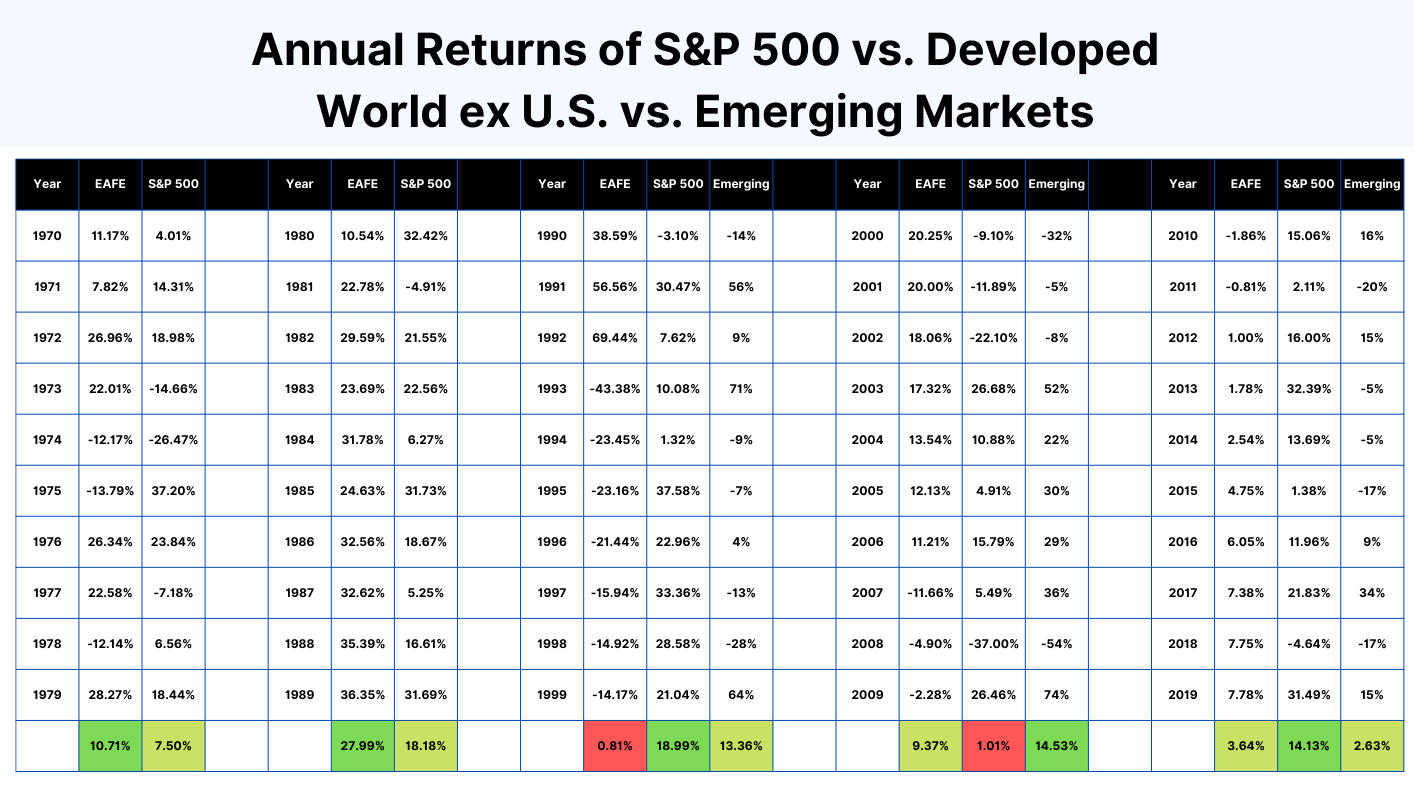
To get a better overview, it’s helpful to break down how these markets have performed over the past 40 years. We see that their returns are quite comparable and how the effect of mean reversion in action plays out when given a long enough time frame.
S&P 500 vs. MSCI World: Basics
Let’s look at the structural similarities of the S&P 500 and MSCI World. Both are what are called stock market indexes. A stock index is a statistical way to measure the change in a group of stocks. These stocks, when combined, provide a snapshot of how well or how badly a particular market is doing. When the value of the stocks in the index fall, the value of the index falls. And conversely, when the value of the index constituents rises, so does the index.
In the case of the S&P 500 index, this snapshot shows how some of the largest public companies in the U.S. are faring right now. For the MSCI World, it’s a broader weather gauge of how stocks in 23 different developed economies are doing altogether. We can boil down the fundamental structural difference between the two indexes to this: The S&P 500 measures the U.S. economy, while the MSCI World takes the temperature of the developed world economy.
The index/ETF terminology can be confusing. Indexes are benchmarks created by investment analyst firms like MSCI or Standard & Poor’s. You can’t invest directly in an index; they’re just statistical number crunching. But you can invest in them indirectly through investment funds, like mutual funds or exchange-traded funds (ETFs), that own the stocks making up the index.
The S&P 500 index
The S&P 500 is made up of 503 stocks issued by 500 large-cap companies traded on American stock exchanges, either the NYSE, Nasdaq, or Cboe. The index is widely regarded as the best single gauge of the U.S. stock market. It’s a capitalisation-weighted index, which means the bigger the company, the more influence it has on the index. For example, in 2021, only 9 companies made up almost 30% of the index.
Because the S&P only includes large-sized stocks, many U.S.-focused investors instead opt for indexes that claim to be “total stock market” indexes. These include what’s inside the S&P 500 as well as mid-sized and small-sized companies that are left out of the S&P 500. This way, total stock market indexes attempt to measure the performance of all publicly traded U.S. stocks, not just the big names.
The MSCI World index
The MSCI World comprises around 1,500 stocks listed on exchanges in what MSCI refers to as developed countries. The precise number of stocks and the amount of space they take up in the index changes several times during the year as MSCI periodically rebalances the index. For example, as Meta (Facebook) shares lost value in early 2022, their weighting in the index fell, and other companies moved up to take their place.
The top 10 stocks in the MSCI and S&P 500 are nearly identical because the U.S. is home to most of the world’s largest companies. But the MSCI World goes on to include non-U.S. large-cap stocks in its top 100 holdings since it’s a global index. These include Nestlé (Swiss), Roche (Swiss), AstraZeneca (British), ASML Holding (Dutch), Novo Nordisk (Danish), Toyota (Japanese) and many other recognisable names that play an important role in the global economy.
S&P 500 vs. MSCI World: Countries
On the surface, the S&P appears only to cover a single country, the U.S., while the MSCI World casts a much wider net with 23 countries. But once we dig a bit deeper, the picture turns a bit more nuanced. Here’s what to keep in mind in terms of geographical diversification.
S&P 500 countries
S&P 500 investors are much more internationally diversified than they may realise. According to Morningstar’s calculations, around 40% of revenues for S&P 500 companies come from outside the U.S. Have you ever visited a country where you couldn’t find a Coca-Cola? Or where the locals didn’t use iPhones? The Coca-Cola Company is based in Atlanta, but that hasn’t stopped it from selling its products all over the world. The story is more or less similar for other companies that deal internationally. Even gas, which until around 2015 wasn’t exported in large quantities from the U.S., is now being piped out worldwide.
Here’s where the risks lie: S&P 500 companies indeed have roots all over the world, but their parent entities are subject to the U.S. “package”, whether that’s U.S. taxation, political risk, social stability or other factors. It’s hard for anyone not to notice the increasing theatre of unrest in the U.S., whether social or economic. So, the question investors need to ask is whether they think the U.S. will continue to provide the best business environment for companies to grow and thrive.
The MSCI World countries
The MSCI World covers equity from the following 23 developed countries: Australia, Austria, Belgium, Canada, Denmark, Finland, France, Germany, Hong Kong, Ireland, Israel, Italy, Japan, Netherlands, New Zealand, Norway, Portugal, Singapore, Spain, Sweden, Switzerland, the U.K. and the U.S. The noticeable absentees are Poland and South Korea, which are included in the similar FTSE World Index but not the MSCI World. China is another, but the country has historically been difficult for foreign investors to access.
Because the MSCI World is made up of so many countries, the standard assumption is that it’s a diversified index. This is true in the sense that the index “doesn’t care” where the money is, as long as it stays within the developed markets. For example, in an imaginary future, if Switzerland and Germany, for unknown reasons, became home to the world’s largest companies by market capitalisation, the index would rotate towards those countries and swap out the underperformers automatically.
When we look under the hood of the index right now, the country weighting of the MSCI World is quite top-heavy. U.S.-domiciled companies account for almost 68% of its total market capitalisation. Among those, a whole 4.5% and 3.7% are in Apple Inc. and Microsoft Corporation, respectively. Japan is second with around 6.17%, followed by the United Kingdom (4.42%), Canada (3.6%), and France (3.11%), while other countries make up 14.04%. Over the last decade, the index weighting of its non-U.S. constituents has declined significantly, the most notable drop coming from the UK, which has been cut in half.
But then again, when we analyse this concentration from the perspective of how an index is supposed to work, it’s clear that the MSCI World’s composition is a result of regular reviews and rebalancing. It’s the result of changing market conditions, which keep an up-to-date picture of the global stock market over time.
S&P 500 vs. MSCI World: Holdings
The top 10 companies of the S&P 500 and the MSCI World are nearly identical in terms of how much they make up the respective indexes. If we extend the comparison, the total overlap between the two indexes sits at around 65%. This means both indexes are heavily tilted towards the same large-cap U.S. companies and that by buying into the MSCI World index, you’re buying 65% of the S&P 500 in the same package.
This only seems to leave a 35% allocation to the rest of the world, which is not very much when considering the MSCI World’s reputation as a diversified index. Still, it does add a layer of diversification that the S&P 500 cannot provide on its own: Since the World index follows a principle of indifference in terms of how it’s spread out across the countries it covers, it’s chasing performance regardless of whether it comes from the U.S., Europe, or any of the other included markets.
S&P 500 holdings
There are 503 companies in the S&P 500. All S&P 500 companies are headquartered in the U.S. The index’s top 10 constituents or stocks are Apple, Microsoft, Amazon, Tesla, Alphabet (Google), Berkshire Hathaway, United Health, Johnson & Johnson, and Nvidia.
MSCI World holdings
There are around 1,500 companies in the MSCI World, although the exact number fluctuates. The top 10 constituents in the index are Apple, Microsoft, Amazon, Alphabet (Google), Tesla, United Health, Johnson & Johnson, Nvidia, Meta (Facebook), and Exxon. The total index holdings are spread across 23 countries.
S&P 500 vs MSCI World: Sectors
Both indexes have a steep tilt towards information technology, followed by healthcare, financials, and consumer discretionary (goods and services).
| Sector | S&P 500 | MSCI World |
|---|---|---|
| Information Technology | 27.9% | 21.1% |
| Health Care | 14.3% | 14.1% |
| Consumer Discretionary | 11.5% | 10.6% |
| Financials | 10.6% | 13.6% |
| Communication Services | 8.4% | 7.6% |
| Industrials | 7.8% | 9.9% |
| Consumer Staples | 6.6% | 7.8% |
| Energy | 4.4% | 4.9% |
| Utilities | 3.0% | 3.2% |
| Real Estate | 2.9% | 2.9% |
| Materials | 2.5% | 4.3% |
S&P 500 vs. MSCI World: Overlap
The overlap between the S&P 500 and MSCI World is significant, both in terms of geographical concentration, sectoral spread, and the heavy allocation towards a few megacorporations. 486 of the same stocks are found in both indexes, which means that 96.6% of the 503 stocks issued by S&P 500 companies are also in MSCI World. If we reverse the perspective, around 32.4% of MSCI World’s individual holdings are in the S&P 500. The overlap in weighting of those companies included in both indexes is about 65%.
A pessimistic view of this high degree of overlap would be that you’re not really spreading out your risk much by buying into the MSCI World index as opposed to if you just invested in the S&P 500. The optimistic interpretation is that MSCI World gives you the best of the U.S. package while also heeding the principle of geographic diversification, even if the sector allocation is still top-heavy. You’re more or less getting the same cake but with a sprinkle of international flavour.
S&P 500 vs. MSCI World: Risks
When analysing risk factors and comparing these among two different indexes, there are a few different categories to consider.
Index risk
We shouldn’t forget that the S&P 500 and MSCI World are human-made constructs. Although based on publicly available methodologies, they are subject to limitations regarding how well they represent the “reality” of the financial markets they wish to reflect. You can review and research further the methodology of S&P’s U.S. indexes and the MSCI’s if you’re interested in exploring this topic in depth.
Between the two, the S&P 500 is subject to more human bias than the MSCI World. Not because it only includes U.S.-based companies but due to its methodology and review process. Unlike indexes like the Russell 3000, which are strictly rule-based (e.g., the weighting of companies in the index is based on their market capitalisation), the S&P 500 includes the intervention of a committee made up of anonymous members. This index committee handpicks the stocks that enter and exit the index among potential candidates. While this human element doesn’t necessarily introduce bias, it does bring a peculiar aspect of arbitrariness to the index.
It’s easy to mistake the S&P 500 for a passive index following the U.S. stock market, but that would be wrong. In fact, it’s quite an exclusive list. There is a secret committee that meets four times a year to deliberate on which companies should be included in, or removed from, the index.
Another thing that’s not widely known is that the S&P 500 represents 500 U.S. large companies but is not necessarily the largest. Also, 500 may have been an adequate number in the 1950s, but it’s not nearly enough to capture the breadth of today’s U.S. economy. There are now more than 4,000 publicly traded companies in the United States.
The MSCI World index is much more systematic in its approach. The index is based on MSCI’s Global Investable Indexes (GIMI) Methodology, which is comprehensive and available for anyone to review. Its rules are clear and objective in terms of what stocks are selected and how they’re weighted. The main point of criticism is the omission of countries that other index providers consider developed markets, such as Poland and South Korea.
Market risk
Second, we have what we could call non-diversifiable or market risk. This type of risk is inherent to the markets. It cannot be diversified away by investing in a market-tracking index fund. Essentially, it’s the risk that the market as a whole will go up or down. In the current state of play, U.S. equities dominate on the international scene, so the market risk in world and international indexes is heavily intertwined with U.S. market risk. To counter this type of risk, investors can consider non-financial assets like property, or if they want to stay within the realm of stocks and shares, adapt a long time horizon for their investments.
Country risk
The third point, and here the MSCI World index has a clear advantage because it straddles 23 markets, is country risk. The question of whether one very successful country, the U.S., can continue to single-handedly dominate the performance of the world economy is a legitimate one, and the allure of higher returns over geographical diversification is understandable. The puzzle is that the very same reasons that make U.S. stocks look more attractive (higher returns potential) are also the ones that could lead to their underperformance in the future.
It’s not only about the risk that a particular country’s economy or political situation could deteriorate, thereby affecting the value of companies headquartered in that region. It’s also about the less dramatic probability of something similar to what happened to Japan in the early 1990s – where a country didn’t become unstable or on a trajectory of decline, but its financial markets just stopped growing for a long time.
The viewpoint prevalent among European and other non-U.S. investors is that the U.S. equities-only approach repeats the errors made by many Japanese investors in the 1980s who invested solely in domestic securities. Many investors have a short memory, and it’s easy to forget that the U.S. outperformance in recent years is nothing exceptional that other markets haven’t achieved in the past. For example, from around 2004 to 2012, equities from Europe and emerging markets trounced their U.S. counterparts. While the MSCI World’s performance is being dragged down by the non-U.S. stock sector, the benefit is that if the U.S. market falls, international stocks may hold up better and offer some protection for losses.
S&P 500 vs. MSCI World: History
It’s interesting to take a step back and look at how these two indexes have come about, seeing they’re so hyped among investors.
The foundation of the S&P 500 name is as follows: Henry Poor was a 19th-century financial analyst who compiled an annual book that listed publicly traded railway companies in the United States. After his death, Poor’s publication, “Poor’s Directory of Railroad Officials”, merged with the Standard Statistics Company, which resulted in the creation of Standard & Poor’s Corporation in 1941.
The S&P 500 index, first called the Composite Index, was created on a modest scale in 1923. It began with 90 equities in 1926 and expanded to its famous 500 in 1957. The 500 companies it tracks are large, U.S.-based corporations that trade publicly, meaning their stocks can be bought and sold by the public on stock exchanges. The weighting of stocks in the index is determined by their float-adjusted market capitalisation. What this means is large companies have a more significant impact on the direction of the index than small companies. For example, the top nine companies in the S&P 500 list accounted for 28.1% of overall market value in 2021.
The history behind the MSCI World isn’t nearly as exciting as Henry Poor’s obsessive passion for tracking railroad companies. It started in 1968 when Capital International, an investment management company, licensed its global equity indexes to Morgan Stanley, hence the name Morgan Stanley Capital International (MSCI). The same year, MSCI launched its World Index, intending to track stocks from the developed or industrialised parts of the world. The MSCI Developed Market Index started in 1969, while the Emerging Markets Index was launched in 1987.
S&P 500 vs. MSCI World: Takeaway
Should you add international diversification to your portfolio or bet everything on U.S. stocks? There is no way to know if stock returns in the U.S. will be as high as they have been in the past or if the Americans will pass the baton to another region. The number of unknown unknowns is too great to make any definitive statement either way.
If history is any guide, we should expect future down periods in any given market and assume that winners will rotate between markets, just as they have in the past. Investors who rely on a single region for their equity exposure can find themselves in an unfortunate position where they have to sell at inopportune times to meet their cash needs. Recoveries can take decades or never happen at all, as the Japanese investors who witnessed first-hand in the 1980s.
One of the best ways to balance these unpredictable forces is to build a globally diversified portfolio of developed and emerging market stocks. This will ensure that you always have some geographic region working in your favour and provide some ballast during the down periods for the other markets. With a global index fund or world plus emerging markets combo, you risk sacrificing a few percentage points of return in good times, but you also get the peace of mind that comes with being ready for a potential change in market leadership.
Disclosure: The author owned funds tracking the MSCI World and MSCI Emerging Markets at the time of publication.
Sources
- Saphier, Melissa et al. “Geographic Diversification Can Be a Lifesaver, Yet Most Portfolios Are Highly Geographically Concentrated.” Bridgewater Associates, 2019.
- Amundi. “Global ETF Net Flows May 2022.” https://www.fundresearch.de/fundresearch-wAssets/docs/Amundi-ETF-Global-ETF-YTD-Flows-Mai-2022-Press.pdf. Accessed Jan. 17, 2023.
- S&P Dow Jones Indices. “S&P 500.” S&P Global, https://www.spglobal.com/spdji/en/indices/equity/sp-500/#overview. Accessed Jan. 17, 2023.
- Butters, John. “Earnings Insight.” FactSet, https://advantage.factset.com/hubfs/Website/Resources%20Section/Research%20Desk/Earnings%20Insight/EarningsInsight_011323.pdf. Page 29. Accessed Jan. 13, 2023.
- Fidora, Michael, et. al. “Home bias in global bond and equity markets: The role of real exchange rate volatility.” Journal of International Money and Finance 26, no. 4 (2007): 631-655. doi: 10.1016/j.jimonfin.2006.11.006
- Calculated based on the FTSE All-World Index factsheet, dated Dec. 30th, 2022.
- Davidson, James Dale and William Rees-Mogg. The Great Reckoning: Protecting Yourself in the Coming Depression. Page 159.
- Quinn, William and John D. Turner. Boom and Bust: A Global History of Financial Bubbles. Illustrated. Cambridge University Press, 2020.